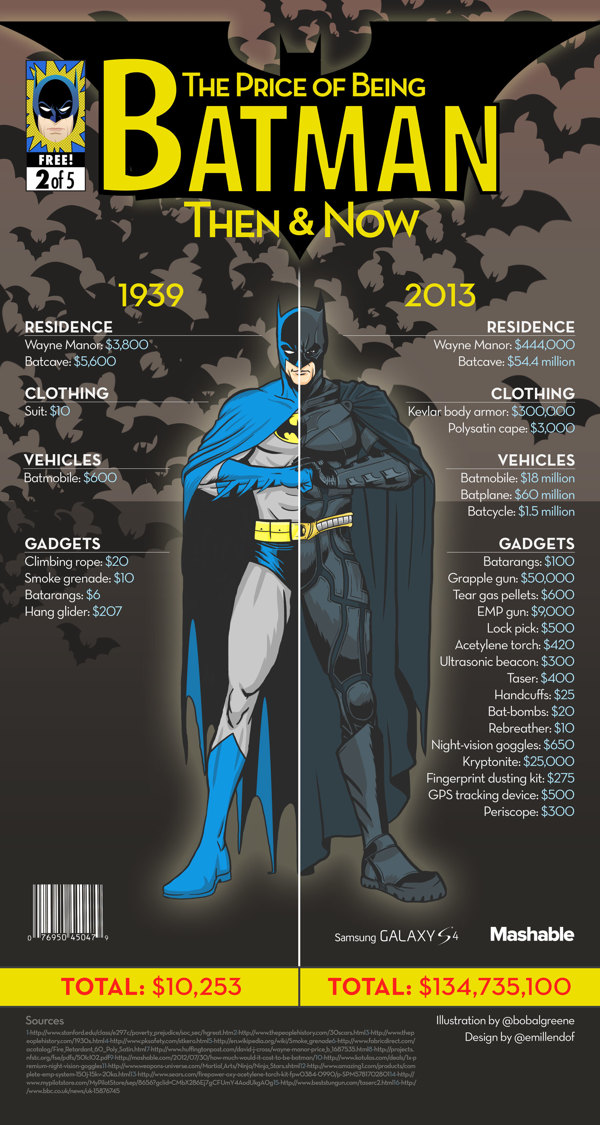
What is an infographic?
An infographic presents data in a concise, highly visual format.

Source (and full infographic): https://thenextweb.com/wp-content/blogs.dir/1/files/2013/10/what-is-an-infographic.jpg
What might go into an infographic:
Use Canva or Adobe Illustrator to create an infographic - Both apps are available in the iPad manager.

From Hotter Butter Studio: http://www.hotbutterstudio.com/#/alps/
Omaha Public Schools does not discriminate on the basis of race, color, national origin, religion, sex, marital status, sexual orientation, disability, age, genetic information, citizenship status, or economic status in its programs, activities and employment and provides equal access to the Boy Scouts and other designated youth groups. The following individual has been designated to address inquiries regarding the non-discrimination policies: Superintendent of Schools, 3215 Cuming Street, Omaha, NE 68131 (531-299-9822).
Las Escuelas Públicas de Omaha no discriminan basados en la raza, color, origen nacional, religión, sexo, estado civil, orientación sexual, discapacidad , edad, información genética, estado de ciudadanía, o estado económico, en sus programas, actividades y empleo, y provee acceso equitativo a los “Boy Scouts” y a otros grupos juveniles designados. La siguiente persona ha sido designada para atender estas inquietudes referentes a las pólizas de no discriminación: El Superintendente de las Escuelas, 3215 Cuming Street, Omaha, NE 68131 (531-299-9822).